

IBM’s 2026 Cost of a Data Breach Report found the global average breach cost reached USD $4.99 million, a record high driven by AI-powered attacks up 56% year over year.¹ Supply chain attacks compound the exposure: ReversingLabs research confirmed software supply chain attacks grew 1,300% over three years.² The Log4j vulnerability alone generated over 10 million attack attempts per hour at peak exploitation.³ Organizations that treat security as a final-stage gate accumulate deferred risk with every release.
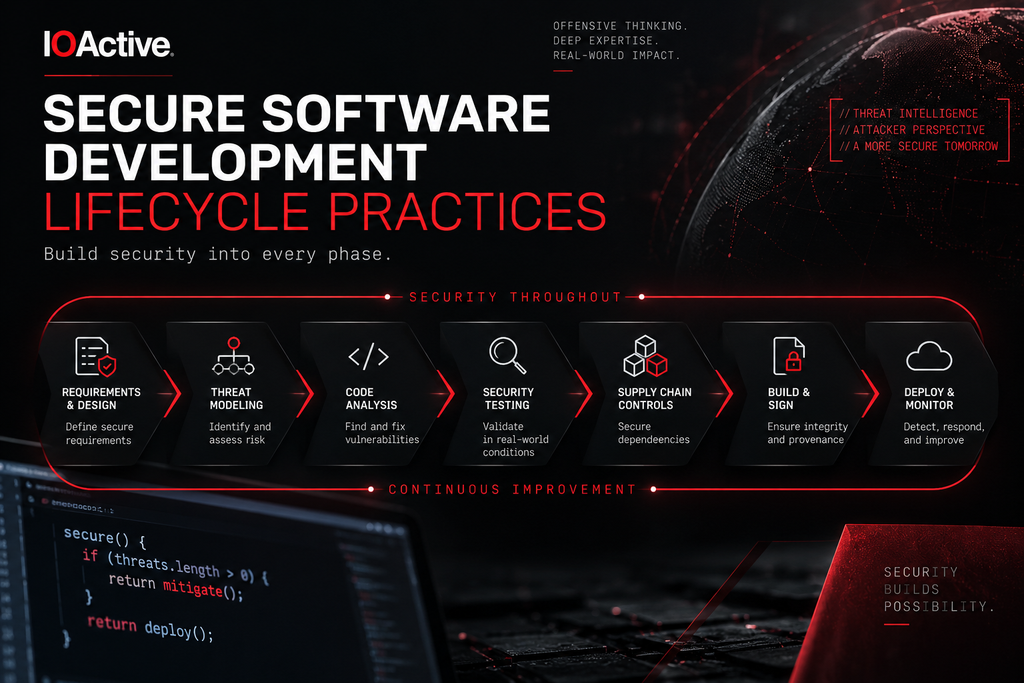
Secure software development lifecycle practices embed security controls at every phase of the software development process, reducing remediation costs and organizational risk.
“The most effective secure software development lifecycle practices address security before software is deployed, not after vulnerabilities are discovered.”
– IOActive Security Team
Secure SDLC Best Practices: Controls, Outputs, and Metrics
| Best Practice | What It Does | Key Output | Success Metrics | Risk If Skipped |
| Security Requirements Mapping | Translates compliance and business requirements into testable acceptance criteria before development begins | Documented security requirements and acceptance criteria | % requirements with security acceptance criteria; compliance gap rate | Missing controls, regulatory gaps, late-stage rework |
| Threat Modeling (STRIDE/DREAD) | Identifies attack paths in planned architecture using structured frameworks before a line of code is written | Threat register, attack surface map | # threats identified per review; % mitigated before development starts | Architectural flaws reach production with costly remediation |
| Static Code Analysis (SAST) | Scans source code for insecure patterns at commit or build time | Clean code reports, flagged findings | # high/critical findings per 1,000 lines of code; mean time to remediate | Injection flaws, hardcoded secrets, insecure patterns shipped |
| Dynamic Application Security Testing (DAST) | Tests running applications against real attack patterns pre-release | Validated vulnerability findings | # runtime vulnerabilities found; % of API endpoints tested | Runtime and authentication flaws missed before release |
| Software Composition Analysis (SCA) + SBOM | Inventories open-source dependencies and tracks known CVEs; SBOM documents every component in the build | CVE inventory, Software Bill of Materials | % dependencies on a supported version; # libraries no longer actively maintained | Vulnerable third-party libraries deployed; supply chain exposure |
| Artifact Signing and Configuration Hardening | Signs build artifacts cryptographically and audits deployment configurations to prevent tampering | Signed artifacts, hardened deployment configurations | % of artifacts signed; # misconfigurations resolved at deploy gate | Supply chain tampering, misconfigured production environments |
| Vulnerability Management and SLA Enforcement | Prioritizes and remediates vulnerabilities by CVSS score, production reachability, and CISA KEV status | Remediated CVE backlog, SLA compliance metrics | Mean time to remediate (MTTR) by severity tier; % SLA compliance | Unpatched known-exploited vulnerabilities accumulate and expand breach risk |
| Security Governance and Program Maturity | Establishes named ownership, enforceable security gates, and maturity benchmarks aligned to NIST SP 800-218 or OWASP SAMM | Maturity score, named control owners, audit evidence | # controls with named owners; % security gates enforced in CI/CD; maturity level progression | Controls exist on paper only; programs consistently underperform without governance infrastructure |
Gaps at any single phase propagate forward. A vulnerability introduced at requirements and missed through design, development, and testing arrives in production fully formed and significantly more expensive to remediate.
Run Threat Modeling Before Writing Code
The highest-leverage security activity happens before a single line of code is written. Threat modeling, using frameworks such as STRIDE or DREAD, gives teams a structured method for identifying attack paths in planned architecture and building in controls before architectural decisions become costly to reverse. A research-fueled Secure Development Lifecycle engagement brings genuine adversarial thinking to this process, applying real-world offensive experience to surface the systemic risks that automated tools routinely overlook.
Threat Modeling Method Comparison
| Method | What It Does | Who Runs It | What It Provides | Effort Level | Best Fit |
| STRIDE | Categorizes threats by class: Spoofing, Tampering, Repudiation, Information Disclosure, Denial of Service, Elevation of Privilege | Security architects, senior developers | Comprehensive attack class mapping across trust boundaries | Medium — 1 to 2 days per system review | Application architecture and trust boundary analysis |
| DREAD | Scores threats on Damage, Reproducibility, Exploitability, Affected users, and Discoverability to produce a ranked risk list | Security engineers, risk teams | Prioritized threat list by exploitability and business impact | Low to medium — hours per threat register | Risk-ranking identified threats for remediation sequencing |
| Attack Trees | Decomposes the path to a specific high-value target into branches of possible attack methods | Penetration testers, security researchers | Targeted attack path analysis for critical or high-value components | High — days to weeks for complex targets | Component-level analysis of specific high-value targets |
Method selection depends on the question the team needs to answer. STRIDE maps attack classes broadly across a system; DREAD narrows findings to prioritized risk; Attack Trees decompose the path to a specific high-value target. Most mature programs apply more than one method, selecting based on the architecture under review and the risk questions at hand.
Integrate Code Analysis and Supply Chain Controls Into Every Pipeline Stage
Static analysis (SAST) catches insecure code patterns during development, while dynamic testing (DAST) validates a running application against real attacker behavior. Supply chain exposure requires its own layer of controls. Sonatype’s research found open-source supply chain attacks growing at 742% annually.⁴ A dedicated Supply Chain Integrity assessment applies attacker-mindset analysis from silicon through the application layer. A 2025 third-party assessment of Microsoft’s Signing Transparency service confirmed strong implementation security and identified defense-in-depth improvements.⁵ Core controls include SBOM management, SCA in CI/CD pipelines, dependency pinning, and artifact signing.
Code Analysis and Supply Chain Controls
| Control | What It Does | Who Runs It | Integration Point | Risk Addressed |
| SAST in CI/CD | Scans source code for insecure patterns automatically at commit or merge | Developer pipelines, security champions | Git pre-commit hook or CI pipeline | Insecure patterns caught before code reaches the main branch |
| DAST pre-release | Sends attack traffic to a running application to surface runtime flaws | QA teams, security engineers | Staging environment or pre-release gate | Runtime and authentication flaws not visible to static analysis |
| SCA in build pipeline | Scans open-source dependencies against CVE databases with each build | DevOps, security teams | Build pipeline or dependency resolution step | Known CVEs in third-party libraries before they reach production |
| SBOM + artifact signing | Generates a complete bill of materials and cryptographically signs build outputs for every release | DevSecOps, release engineering | Release pipeline or deployment gate | Supply chain tampering and untracked third-party components |
Layering all four controls closes distinct gaps at different pipeline stages. SAST and DAST address first-party code at different points in the lifecycle. SCA and SBOM management address third-party and supply chain risk at the build and release stages. Each layer reinforces the others: SAST catches what code review misses, DAST catches what SAST cannot see at runtime, and SCA flags risks that originate entirely outside the team’s codebase.
Prioritize Vulnerabilities With Contextualized SLA Frameworks
Datadog’s 2025 DevSecOps research found that the median software dependency is 215 days behind its latest major version, with one in two services running libraries no longer actively maintained.⁶ Effective vulnerability management requires contextualized prioritization based on CVSS score and production reachability, SLA-based ownership, and regression testing to confirm fixes hold. Listings on the CISA Known Exploited Vulnerabilities catalog indicate confirmed real-world exploitation and warrant accelerated remediation timelines regardless of the base CVSS score.
Vulnerability Remediation SLA Framework
| Priority Tier | Criteria | Target SLA |
| Critical | CVSS 9.0+, internet-exposed, CISA KEV listed | 24–72 hours |
| High | CVSS 7.0–8.9, production reachable | 7–14 days |
| Medium | CVSS 4.0–6.9, limited exposure | 30–60 days |
| Low | Below 4.0 or non-production | 90 days |
SLAs paired with named ownership and enforced timelines convert a priority framework into a functioning remediation program. Without that operational infrastructure, vulnerability backlogs expand faster than teams can close them.
Establish Named Ownership and Track Security Program Maturity
Governance gaps are the most common point of failure in secure SDLC programs. Controls require named ownership and enforceable gates; programs without both consistently underperform regardless of tooling investment. The NIST Secure Software Development Framework (SP 800-218) and OWASP SAMM provide structured maturity models for building and measuring program progress.⁷ Red Team and Purple Team exercises close the feedback loop, testing whether development-phase controls hold under real adversarial simulation and informing the next cycle of program improvement.
Assess Your Current Maturity Level and Close the Gaps Systematically
| Maturity Level | Characteristics | Next Steps to Advance |
| Ad Hoc | Reactive, no formal process, incident-driven patching | Assign one control owner per business unit; document current state versus target state; implement a vulnerability tracking system |
| Defined | Basic security gates, SAST in CI/CD, vulnerability tracking | Add threat modeling at the design phase; adopt SLA-based remediation; integrate SCA into the build pipeline |
| Managed | Threat modeling, SCA, SLA-driven remediation, metrics reporting | Automate artifact signing; run quarterly adversarial simulations; establish an SBOM management program |
| Optimized | Automated supply chain controls, adversarial simulation, SBOM management | Integrate continuous Red Team feedback into the SDLC; benchmark the program annually against NIST SP 800-218 or OWASP SAMM |
Most organizations enter at Ad Hoc or Defined. Identifying the gaps between the current state and the next level, then addressing them incrementally, produces durable outcomes. Each level builds on the controls established in the previous one, making systematic progression the most reliable path to program improvement.
Build Security Into Your Development Process With IOActive
Secure software development lifecycle practices address vulnerabilities at the phase where remediation is most efficient: before the code ships. Organizations that build security into design, development, and deployment produce software that holds up under real-world adversarial pressure and satisfies the compliance obligations regulators and insurers continue to tighten. IOActive’s 25+ years of research-driven assessments, landmark vulnerability disclosures, and straight-talk approach give clients an honest picture of where their program creates risk.
Sources
- IBM Security. Cost of a Data Breach Report 2026. https://www.ibm.com/reports/data-breach
- ReversingLabs. The State of Software Supply Chain Security 2024. https://www.reversinglabs.com/sscs-report-2024
- IOActive. Supply Chain Integrity. https://www.ioactive.com/service/supply-chain-integrity/
- Sonatype. State of the Software Supply Chain, 10-Year Look. 2024. https://www.sonatype.com/state-of-the-software-supply-chain/2024/10-year-look
- IOActive. Security Assessment of Microsoft’s Signing Transparency. 2025. https://www.ioactive.com/wp-content/uploads/2025/10/Microsoft-Signing-Transparency-Service-Security-Assessment-IOActive-Public-Facing-Report.pdf
- Datadog. State of DevSecOps 2025. April 2025. https://www.datadoghq.com/state-of-devsecops-2025/
- NIST. Secure Software Development Framework (SSDF) SP 800-218. https://csrc.nist.gov/projects/ssdf